- 2023-06-18 17:58:21
- 1525 热度
- 0 评论
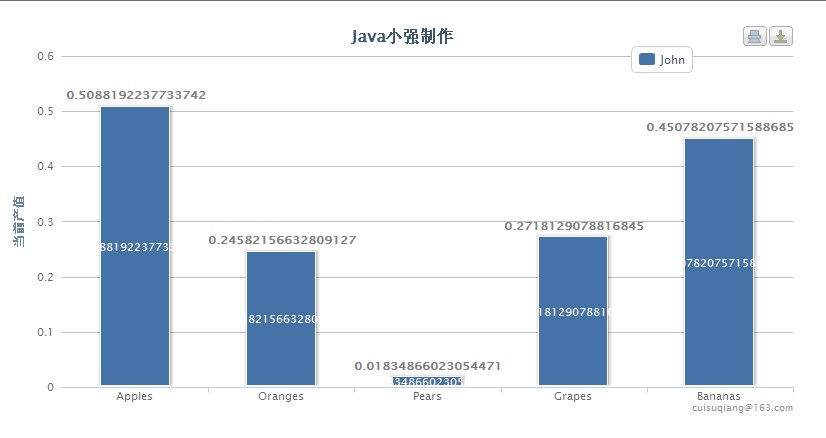
实现一个柱状图,这个柱状图的高度在不停的刷新,效果如下:

官网是没有动态刷新的示例的,由于需要我查看了其源码,并根据之前示例做出了动态柱状图的效果,希望对同学们有用!
看一下代码:
<%@ page language="java" import="java.util.*" pageEncoding="UTF-8"%>
<html>
	<head>
		<title>Highcharts Example</title>
		<script language="javascript" type="text/javascript" src="jquery.min.js"></script>
		<script language="javascript" type="text/javascript" src="highcharts.js"></script>
		<script language="javascript" type="text/javascript" src="exporting.js"></script>
<script type="text/javascript">
var chart;
$(document).ready(function() {
	chart = new Highcharts.Chart({
		chart: {
			renderTo: 'container',
			type: 'column',
			events: {
              load: function() {
                  // set up the updating of the chart each second
                  var series = this.series[0];
                  setInterval(function() {
                   	  var data = [];
                   	  data.push(['Apples', Math.random()]);
                   	  data.push(['Oranges', Math.random()]);
                   	  data.push(['Pears', Math.random()]);
                   	  data.push(['Grapes', Math.random()]);
                   	  data.push(['Bananas', Math.random()]);
                      series.setData(data);
                  }, 2000);
              }
          }
		},
		title: {
			text: '<b>Java無名制作</b>'
		},
		xAxis: {
			categories: ['Apples', 'Oranges', 'Pears', 'Grapes', 'Bananas']
		},
		yAxis: {
			min: 0,
			title: {
				text: '当前产值'
			},
			stackLabels: {
				enabled: true,
				style: {
					fontWeight: 'bold',
					color: (Highcharts.theme && Highcharts.theme.textColor) || 'gray'
				}
			}
		},
		legend: {
			align: 'right',
			x: -100,
			verticalAlign: 'top',
			y: 20,
			floating: true,
			backgroundColor: (Highcharts.theme && Highcharts.theme.legendBackgroundColorSolid) || 'white',
			borderColor: '#CCC',
			borderWidth: 1,
			shadow: false
		},
		tooltip: {
			formatter: function() {
				return '<b>'+ this.x +'</b><br/>'+
					this.series.name +': '+ this.y +'<br/>'+
					'Total: '+ this.point.stackTotal;
			}
		},
		plotOptions: {
			column: {
				stacking: 'normal',
				dataLabels: {
					enabled: true,
					color: (Highcharts.theme && Highcharts.theme.dataLabelsColor) || 'white'
				}
			}
		},
		series: [{
			name: 'John',
			data: [5, 3, 4, 7, 2]
		}]
	});
});
</script>
	</head>
	<body>
<div id="container" style="width: 800px;height: 400px"></div>
	</body>
</html>
同样,绘制这个图需要的也是双维数组,我尝试了几个方法,使用 series.setData(data); 可是实现数据的重新指定!
在highcharts.js文件中你可以查看他的一些方法!
0 评论
留下评论
热门标签
- Spring(403)
- Boot(208)
- Spring Boot(187)
- Spring Cloud(82)
- Java(82)
- Cloud(82)
- Security(60)
- Spring Security(54)
- Boot2(51)
- Spring Boot2(51)
- Redis(31)
- SQL(29)
- Mysql(25)
- IDE(24)
- Dalston(24)
- MVC(22)
- JDBC(22)
- IDEA(22)
- mongoDB(22)
- Web(21)
- CLI(20)
- SpringMVC(19)
- Alibaba(19)
- Docker(17)
- SpringBoot(17)
- Git(16)
- Eclipse(16)
- Vue(16)
- ORA(15)
- JPA(15)
- Apache(15)
- Linux(14)
- HTTP(14)
- Mybatis(14)
- Oracle(14)
- jdk(14)
- Tomcat(14)
- Pro(13)
- XML(13)
- JdbcTemplate(13)
- OAuth(13)
- Nacos(13)
- Data(12)
- JSON(12)
- OAuth2(12)
- Myeclipse(11)
- stream(11)
- int(11)
- not(10)
- Bug(10)
- ast(9)
- maven(9)
- Map(9)
- Hystrix(9)
- Swagger(8)
- APP(8)
- Bit(8)
- API(8)
- session(8)
- Window(8)
- HTML(7)
- Github(7)
- JavaMail(7)
- Cache(7)
- File(7)
- IntelliJ(7)
- mail(7)
- windows(7)
- too(7)
- RabbitMQ(6)
- star(6)
- and(6)
- Excel(6)
- pushlet(6)
- Log4J(6)
- apt(6)
- Freemarker(6)
- read(6)
- WebFlux(6)
- JSP(6)
- Bean(6)
- error(6)
- Server(6)
- nginx(6)
- jar(6)
- ueditor(6)
- ehcache(6)
- UDP(6)
- JWT(5)
- rdquo(5)
- PHP(5)
- Struts(5)
- string(5)
- script(5)
- Syntaxhighlighter(5)
- Tool(5)
- Controller(5)
- swagger2(5)
- ldquo(5)
- input(5)

